» Main »
HDGraph - pie charts of disk space usage
Published by Bastian Eicher
- Overview
This is a Zero Install feed. This software cannot be run as an application directly. It is a library for other programs to use.
For more information about Zero Install, see 0install.net.
- Full name
- Description
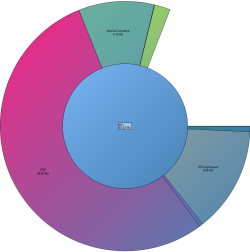
Free tool for Windows able to draw multi-level pie charts of disk space. HDGraph graphically displays the hard disk space usage. It shows all your directories and subdirectories on a single graph, allowing to see the largest ones at a glance.
- Description
Kostenloses Tool für Windows das mehr-stufige Tortendiagramme des Festplattenspeichers darstellen kann. HDGraph visualisiert den Speicherverbrauch. Es zeigt alle Verzeichnisse und Unterverzeichnisse in einem einzelnen Diagramm an und erlaubt Ihnen, die größten auf einen Blick ausfindig zu machen.
- Homepage
- Icon
- Icon
- Available versions
The list below is just for information; Zero Install will automatically select one of these versions for you.
Version Released Stability Platform Download 1.3.0 2009-03-03 stable Any Download (221091 bytes) 1.4.2.0 2012-07-26 stable Any Download (289294 bytes) - Required libraries
This feed does not list any additional requirements.